Category Archives: Maths for Machine Learning

Introduction to Probability

Introduction to Probability

Probability gives the information about how likely an event can occur. Digging into the terminology of the probability:

Trial or Experiment: The act that leads to a result with certain possibility.
Sample space: The set of all possible outcomes of an experiment.
Event: Non empty subset of sample space is known as event.

So, probability is the measure of how likely an event is when an experiment is conducted.

Basic probability calculation

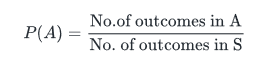
As per the definition, if A is an event of an experiment and it contains n outcomes and S is the sample space then,

1

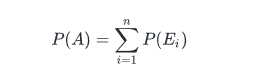
where E1……En are the outcomes in A. If all the outcomes of the experiment are equally likely then

2

Hence the value of probability is between 0 and 1. As the sample space is the whole possible set of outcomes, P(S)=1

Complement of A: Complement of an event A means not(A). Probability of complement event of A means the probability of all the outcomes in sample space other than the ones in A. Denoted by Ac  and P(Ac)=1-P(A)

Union and Intersection: The probability of intersection of two events A and B is P(A∩B). When event A occurs in union with event B then the probability together is defined as P(A∪B)=P(A)+P(B)-P(A∩B) which is also known as the addition rule of probability.

Mutually exclusive: Any two events are mutually exclusive when they have non-overlapping outcomes i.e. if A and B are two mutually exclusive events then, P(A∩B) =0 . From the addition rule of probability P(A∪B)=P(A)+P(B) as A and B are disjoint or mutually exclusive events.

Independent: Any two events are independent of each other if one has zero effect on the other i.e. the occurrence of one event doe not affect the occurrence of the other. If A and B are two independent events then, P(A∩B)=P(A)*P(B).

Sum rule: Sum rule states that

3

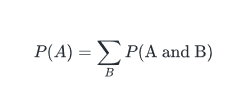
This is also known as marginal probability as it denotes the probability of event A by removing out the influence of other events that it is together defined with.
Example: If the probability that it rains on Monday is 0.3 and the probability that it rains on other days this week is 0.6, what is the probability that it will rain this week?
Solution: From the sum rule, P(rain) = P(rain and it is a Monday) + P(rain and it is not Monday). Hence the P(rain) = 0.7

Useful libraries for data analysis

Capturex

Following are a list of libraries, you will need for any scientific computations and data analysis:

  • NumPy stands for Numerical Python. The most powerful feature of NumPy is n-dimensional array. This library also contains basic linear algebra functions, Fourier transforms,  advanced random number capabilities and tools for integration with other low level languages like Fortran, C and C++
  • SciPy stands for Scientific Python. SciPy is built on NumPy. It is one of the most useful library for variety of high level science and engineering modules like discrete Fourier transform, Linear Algebra, Optimization and Sparse matrices.
  • Matplotlib for plotting vast variety of graphs, starting from histograms to line plots to heat plots.. You can use Pylab feature in jupyter notebook to use these plotting features inline. If you ignore the inline option, then pylab converts jupyter environment to an environment, very similar to Matlab. You can also use Latex commands to add math to your plot.
  • Pandas for structured data operations and manipulations. It is extensively used for data munging and preparation. Pandas were added relatively recently to Python and have been instrumental in boosting Python’s usage in data scientist community.
  • Scikit Learn for machine learning. Built on NumPy, SciPy and matplotlib, this library contains a lot of effiecient tools for machine learning and statistical modeling including classification, regression, clustering and dimensionality reduction.
  • Statsmodels for statistical modeling. Statsmodels is a Python module that allows users to explore data, estimate statistical models, and perform statistical tests. An extensive list of descriptive statistics, statistical tests, plotting functions, and result statistics are available for different types of data and each estimator.
  • Seaborn for statistical data visualization. Seaborn is a library for making attractive and informative statistical graphics in Python. It is based on matplotlib. Seaborn aims to make visualization a central part of exploring and understanding data.
  • Bokeh for creating interactive plots, dashboards and data applications on modern web-browsers. It empowers the user to generate elegant and concise graphics in the style of D3.js. Moreover, it has the capability of high-performance interactivity over very large or streaming datasets.
  • Blaze for extending the capability of Numpy and Pandas to distributed and streaming datasets. It can be used to access data from a multitude of sources including Bcolz, MongoDB, SQLAlchemy, Apache Spark, PyTables, etc. Together with Bokeh, Blaze can act as a very powerful tool for creating effective visualizations and dashboards on huge chunks of data.
  • Scrapy for web crawling. It is a very useful framework for getting specific patterns of data. It has the capability to start at a website home url and then dig through web-pages within the website to gather information.
  • SymPy for symbolic computation. It has wide-ranging capabilities from basic symbolic arithmetic to calculus, algebra, discrete mathematics and quantum physics. Another useful feature is the capability of formatting the result of the computations as LaTeX code.
  • Requests for accessing the web. It works similar to the the standard python library urllib2 but is much easier to code. You will find subtle differences with urllib2 but for beginners, Requests might be more convenient.

data_analysis-11397766-original.jpg

Additional libraries:

  • os for Operating system and file operations
  • networkx and igraph for graph based data manipulations
  • regular expressions for finding patterns in text data
  • BeautifulSoup for scrapping web. It is inferior to Scrapy as it will extract information from just a single webpage in a run.

main-qimg-fad2e6702b134e3853707daa53214314.png